Australia’s exports of recovered paper totalled 1.022 million tonnes in 2020, down just 4.3% compared with 2019. While newsworthy, the really important news in the market is that Indonesia has almost exactly replaced the influence of China for Australian exporters, accounting for 37% of total shipments in 2020 and a blistering 60% in the month of December. Source: IndustryEdge
With shipments to China crumbling to just 0.6 kt in December, it seems likely that Indonesia will continue its dominant position now that China has completely exited the market.
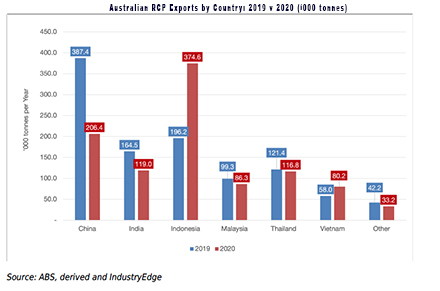
This first chart compares exports to the main destination countries for the last two years. It clearly shows the rise in exports to Indonesia has come only because of the loss of exports to China.
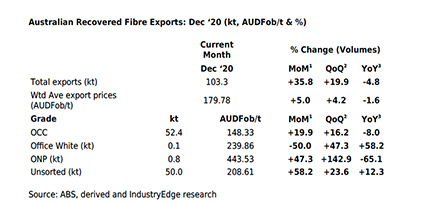
In December, Australia’s recovered paper exports totalled 103.3 kt, the highest monthly volume since March 2020. The monthly weighted average export price was AUDFob179.78/t, to some extent supported by the recent strength of the Australian dollar, with the approximate monthly weighted average US dollar price at USDFob138/t.
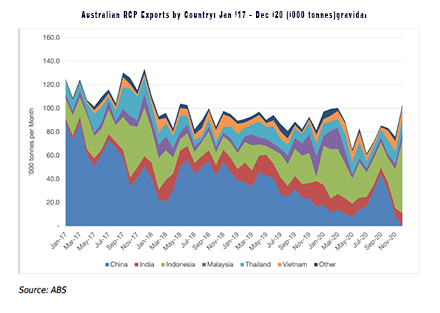
The second chart displays exports by country on a different and longer-term basis.
An interesting feature of the deliveries to Indonesia is they are reported to be into established operations, mainly for corrugated box manufacture.
The interest is that although there have been some instances of producers in mainland China establishing alternative supply lines in Indonesia, they have been far more active in Vietnam, Thailand and some other countries. It might have been expected shipments of recovered paper no longer going to China, would have been diverted to countries where the Chinese box makers retain their influence.
That has happened, but not to the extent originally imagined. In 2020 shipments to Thailand totalled 117 kt, down 4% on a year earlier, those to Vietnam reached a record 80 kt, up 38% on the prior year and to Malaysia, hit 86 kt, down 13% on the prior year.
As the next chart shows, exports in December continued to see Unbleached Kraft (OCC) and Mixed/Unsorted grades duelling for primacy in the market. OCC exports totalled 52.4 kt for the month, with Unsorted exports hitting a five-year monthly high of 50.0 kt.
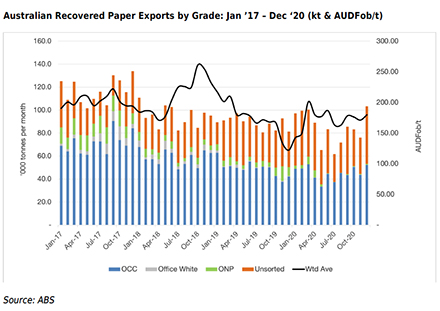
Exports of Bleached Chemical (Office White) and Mechanical (ONP and OMG) have all but disappeared from the export market. The average OCC price leaped to AUDFob148.33/t in December, a 16% rise on the prior month, but still around AUD30/t below the weighted average price and AUD60/t below the average Unsorted price.
At AUDFob208.81/t in December, the average Unsorted price was at its lowest since February 2020, while the OCC average price was at its highest since March 2020. An exporter advised IndustryEdge they had experienced support for this level of OCC pricing that reflected relative US dollar prices for alternative supplies from elsewhere in Asia and even from the US itself.
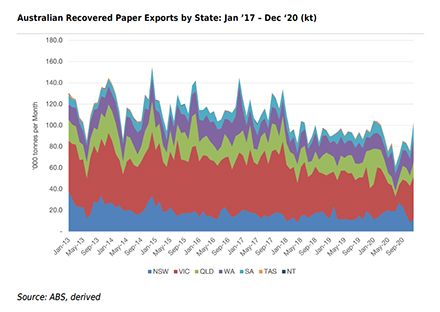
As the final chart shows, Victoria’s exports continue to expand, while those from New South Wales have declined. The recent differences between the two states appears to be commercially oriented, rather than strategic, but it is worth noting that exports in New South Wales had risen through the middle of 2020 and are possibly coming back to trend.